

Adelaide landlords who understand where their suburb sits in the property cycle can make better decisions on rent pricing, lease renewals, and acquisition timing. Right now, HtAG Analytics data shows a meaningful share of Australian suburbs in early recovery or expansion, and NAB's May 2026 Adelaide report confirms the local market is operating under tight conditions. The practical takeaway: prioritise asset quality, tenant retention, and suburb-level data over national headlines.
Key signals right now:
- Adelaide vacancy sits at approximately 0.9%, well below the national band of 1.2–1.5%
- Gross rental yields have compressed, reflecting strong capital value growth
- House values recorded strong annual growth in the year to May 2026
Key takeaways
Adelaide landlords who apply a four-phase cycle framework to suburb-level data, prioritising tenant retention and asset quality, are best positioned to protect yields and reduce vacancy risk in the current market.
| Point | Details |
|---|---|
| Adelaide vacancy is tight | At 0.9% in May 2026, Adelaide's vacancy is among the tightest of any Australian capital. |
| Yield compression is real | Gross yields have compressed as strong capital growth outpaces rent rises. |
| Three signals to watch | GRC, stock on market, and days on market together give reliable suburb-level phase positioning. |
| Suburb cycles vary widely | Local cycles range from 6 to 18 years; SA supply stickiness can extend imbalances. |
| HOSO Real Estate | Applies cycle-aware rent setting, tenant retention, and SA compliance management for Adelaide landlords. |
Table of Contents
- How residential rental market cycles work: the four phases
- How each cycle phase affects your rental income and vacancy
- What signals tell you which phase your suburb is in
- Why suburb cycles differ from national averages
- Phase-by-phase actions for Adelaide landlords
- Adelaide and South Australia: what makes the local cycle different
- How to assess your Adelaide rental property today
- How cycle positioning is assessed in this article
- HOSO Real Estate's approach to cycle-aware property management
- Your Adelaide portfolio deserves cycle-aware management
- Sources
How residential rental market cycles work: the four phases
The property cycle, sometimes visualised as a property clock, moves through four phases: recovery, expansion, hyper-supply, and recession. HtAG Analytics and Canstar both use this framework, and it applies at the suburb level, not just nationally.
Recovery follows the bottom of the cycle. Vacancies are still elevated but beginning to fall. Rents stabilise and then tick upward. Landlord priorities: secure quality tenants on longer leases, defer non-urgent capital works, and monitor stock on market weekly.
Expansion is the growth phase. Demand outpaces supply, vacancies tighten, and rents rise consistently. Yields may compress as values accelerate. Priorities: review rent at each renewal, maintain presentation standards to attract and retain tenants, and assess whether to add to the portfolio.
Hyper-supply occurs when new construction catches up with demand. Vacancy rises, rental growth slows, and tenant choice increases. Landlords who over-extended on incentives or set rents above market face arrears risk. Priorities: hold quality tenants even at modest concessions, defer discretionary upgrades, and tighten tenant screening.

Recession is the contraction phase. Values fall, vacancies rise further, and yields may temporarily improve as prices drop faster than rents. Priorities: protect cash flow, maintain compliance, and identify acquisition opportunities in well-located suburbs.
Pro Tip: In Adelaide, inner-ring suburbs such as Norwood, Unley, and Prospect have historically shown more durable rental demand than outer fringe areas because of their proximity to employment, transport, and services. Asset quality in these locations tends to insulate landlords from the worst of each contraction phase.
How each cycle phase affects your rental income and vacancy
Cycle phases translate directly into the numbers you see in your monthly property report. The table below uses current Adelaide data alongside typical phase behaviour.
| Metric | Recovery | Expansion | Hyper-supply | Recession |
|---|---|---|---|---|
| Vacancy trend | Falling | Tight | Rising | Elevated |
| Rent trend | Stabilising | Rising | Slowing/flat | Soft |
| Yield direction | Improving | Compressing | Variable | Recovering |
| Tenant demand | Recovering | Strong | Easing | Weak |
Adelaide's current vacancy of 0.9% and annual rent growth of approximately 12.2% for houses locally place the Adelaide market firmly in expansion territory. Nationally, renters are spending a significant share of gross median household income on rent, which signals an affordability ceiling is forming even where vacancies remain tight.
Operational effects landlords notice during each phase:
- Expansion: shorter time-to-lease, fewer concessions needed, higher maintenance requests as tenant expectations rise
- Hyper-supply: longer days on market, more applications with weaker profiles, increased arrears risk
- Recovery: tenant turnover stabilises, maintenance backlog from the recession phase surfaces
What signals tell you which phase your suburb is in
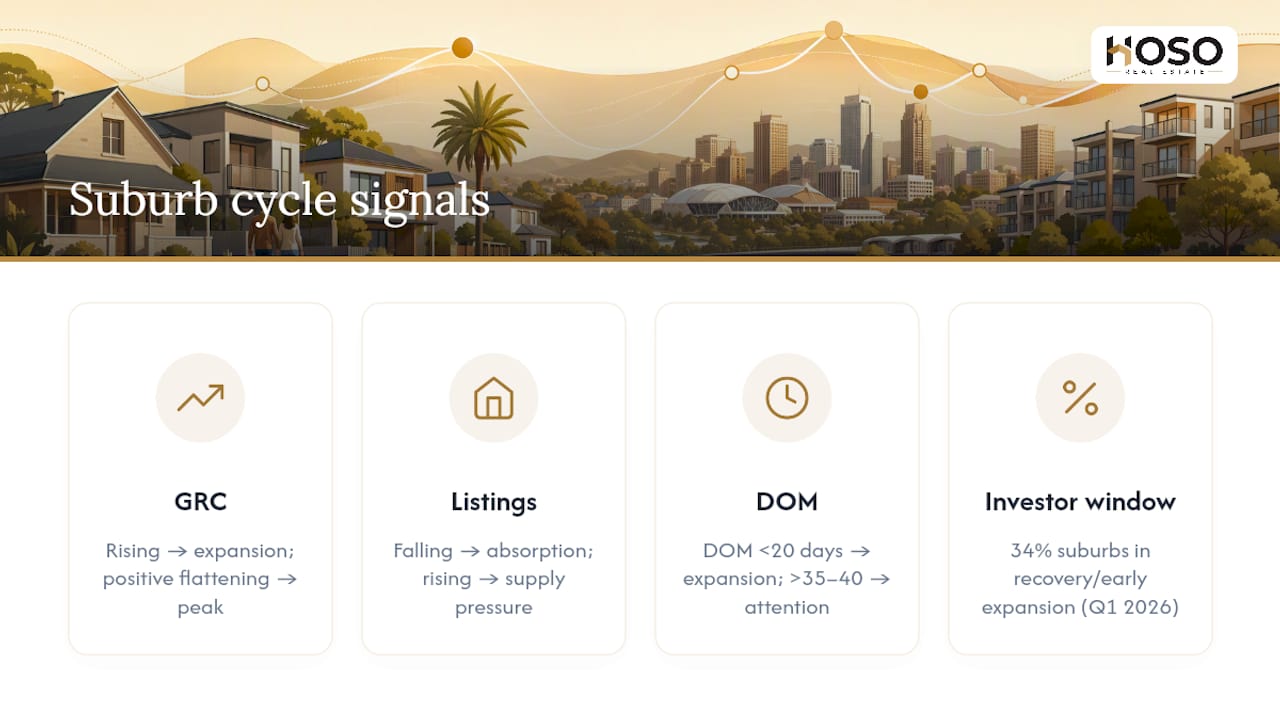
HtAG Analytics uses three converging signals to position a suburb on the cycle: the Growth Rate Cycle (GRC), stock on market, and days on market (DOM). When all three align, the phase signal is reliable.
GRC measures whether price growth is accelerating or decelerating. Rising GRC with positive momentum points to expansion. A GRC that is positive but flattening suggests the peak is approaching.
Stock on market reflects supply pressure. Falling listings in a suburb indicate demand is absorbing supply faster than new stock arrives. Rising listings signal the opposite.
Days on market is the most immediate signal. A DOM below 20 days in Adelaide's current environment is consistent with expansion. DOM climbing above 35–40 days in a suburb warrants attention.
Statistic: HtAG data from Q1 2026 showed approximately 34% of Australian suburbs in recovery or early expansion, representing a data-driven entry window for investors using suburb-level signals.
Secondary signals worth tracking: vacancy rate, rental growth rate, auction clearance rates, building approvals in the local government area, and employment or migration data from the Australian Bureau of Statistics.
For data sourcing, use HtAG suburb heatmaps for GRC and phase positioning, CoreLogic suburb reports for price series, ABS datasets for population and dwelling approvals, and SA planning portal announcements for supply pipeline signals.
Why suburb cycles differ from national averages
The national average cycle runs roughly a decade from trough to trough according to HtAG data, but individual suburbs range from 6 to 18 years depending on local supply constraints, infrastructure investment, and demographic change. A suburb with limited land release and strong employment proximity will move through recovery and expansion faster than a fringe area with abundant new supply.
Statistic: Adelaide's vacancy of 0.9% in May 2026 is among the tightest of any Australian capital, and house values have risen by 12.2% in the past year, which shortens the local rental response to demand shifts compared with cities running at 1.5% or above.
Drivers of local divergence in Adelaide include: the pace of land release in growth corridors such as Angle Vale and Munno Para, infrastructure announcements like the Torrens to Darlington motorway upgrade, and migration patterns into inner suburbs. Historical research on South Australian rental markets found that private rental supply in SA shows 'stickiness' to labour-market changes, meaning local mismatches can persist longer than national models predict.
Phase-by-phase actions for Adelaide landlords
Knowing the phase is only useful if it changes what you do. Here are concrete actions for each phase.
Recovery
- Secure tenants on 12-month leases to lock in stability as rents begin to rise.
- Review your rent against current comparable listings in the same suburb.
- Address deferred maintenance now, before the market tightens further.
Expansion
- Increase rent at renewal to market rate; reference a current rental appraisal for defensible pricing.
- Tighten tenant screening; strong demand means you can be selective.
- Assess whether to add a property to your portfolio while lending conditions allow.
Hyper-supply
- Retain good tenants even at a modest rent concession; turnover costs more than a small discount.
- Reduce incentives and avoid over-capitalising on upgrades.
- Monitor DOM weekly; if your suburb's DOM rises sharply, adjust asking rent promptly.
Recession
- Focus on cash flow protection: review arrears weekly and act early on any missed payments.
- Maintain compliance with SA tenancy obligations to avoid SACAT exposure.
- Identify well-located properties trading below replacement cost as acquisition candidates.
Pro Tip: In low-vacancy environments like Adelaide's current market, tenant retention is worth more than a marginal rent increase. A vacancy of even two weeks erodes the annual gain from a $20 per week rent rise.
Adelaide and South Australia: what makes the local cycle different
Adelaide's cycle is shaped by factors that national data does not fully capture. NAB's May 2026 report notes that investor lending in SA rose in March 2026 while nationally it retraced, reflecting local confidence in the market's fundamentals.
PerCapita's housing briefing documents rising housing stress in South Australia driven by low incomes, fast rent rises, and limited supply. The SA Government has responded through the SA Housing Trust, the Private Rental Assistance Program, and Affordable Housing Overlay measures. These programmes affect the lower end of the rental market and signal that further rent increases at the bottom of the market face both affordability and policy constraints.
For well-located, quality stock in suburbs like Prospect, Glenelg, or Mitcham, demand remains structurally strong. SA planning and infrastructure announcements, such as new transit corridors or rezoning decisions, tend to move local rental demand more directly than RBA cash rate decisions in the medium term. Monitoring the SA Department of Infrastructure and Transport's project pipeline is a practical monitoring habit for Adelaide landlords.
How to assess your Adelaide rental property today
Use this checklist to place your property on the cycle and decide your next step.
- Phase estimate: Check DOM and stock on market for your suburb via a listing tracker or HtAG heatmap. Is stock falling or rising over the past 60 days?
- Vacancy signal: Is your property leasing within 14 days of listing? If not, your suburb may be softening.
- Rent position: Compare your current rent to three comparable active listings. Are you at, above, or below market?
- Tenant risk: Review your tenant's payment history over the past six months. Any pattern of late payments warrants attention before the next renewal.
- Lease timing: When does your current lease expire? Renewals expiring in winter (June–August) face softer demand; consider a shorter renewal to shift the expiry to spring.
Questions to ask about your specific property:
- Should you increase rent at the next renewal, or hold to retain a reliable tenant?
- Does the property need a presentation upgrade to compete in the current market?
- Is the lease length aligned with where the suburb sits in its cycle?
Pro Tip: In Adelaide's current tight market, well-maintained properties attract and retain higher-quality tenants. Maintenance is not a cost centre; it is a vacancy-reduction strategy.
How cycle positioning is assessed in this article
The phase assessments in this article use the GRC + stock on market + DOM convergence method developed by HtAG Analytics, applied at suburb level. When all three signals point in the same direction, phase confidence is high. When they diverge, the phase is transitional and requires closer monitoring.
Primary data providers used:
- HtAG Analytics: suburb-level cycle positioning and GRC data
- CoreLogic: national and suburb price series and rental commentary
- NAB Adelaide market reports: local vacancy, yield, and lending data
- ABS: population, dwelling approvals, and census data
- RBA: cash rate context and monetary policy signals
A practical note on data lags: settlement-based price data (CoreLogic, ABS) typically lags the market by 30–90 days. Active listing counts and DOM from listing platforms update in near real time. For cycle monitoring, weight the real-time signals more heavily for short-term decisions and use settlement data to confirm trend direction.
HOSO Real Estate's approach to cycle-aware property management
At HOSO Real Estate, cycle thinking is applied to every landlord relationship, not just at acquisition. Suburb-level data informs rent-setting recommendations at each renewal, maintenance scheduling is timed to market conditions, and tenant screening standards are adjusted to reflect vacancy trends. SA tenancy obligations and SACAT processes are factored into every lease decision, so landlords are not exposed to compliance risk when adjusting terms.
CoreLogic's guidance on long-term stewardship aligns with how HOSO Real Estate approaches portfolio management: location quality and tenant quality matter more than trying to time the market. That means recommending well-located Adelaide suburbs, maintaining asset presentation, and protecting yields through retention rather than chasing headline rent increases that risk vacancy.
Your Adelaide portfolio deserves cycle-aware management
HOSO Real Estate works with Adelaide landlords to translate cycle signals into property-level decisions. Whether your property is in recovery and ready for a rent review, or in a softening suburb where tenant retention is the priority, the approach is the same: data first, then action.
HOSO's property management services cover rent setting, tenant leasing, routine inspections, maintenance coordination, and SA tenancy compliance. For landlords who want a current read on where their property sits in the cycle, a rental appraisal is the practical starting point. Contact HOSO Real Estate to arrange a property-specific portfolio review.
Sources
- The Property Market Cycle in Australia: 4 Phases 2026
- The definitive guide to rental property ownership in Australia
- Adelaide property market update may 2026
- Rental Market Trends Shaping Australian Investing in 2026 - Buy Australian Property Investments
- Poverty and housing in SA (briefing paper)
- Property Market Cycles in Australia | Canstar
- Regional rental market responsiveness study (South Australia historical analysis)
- What is the property clock and how does it work? | Finder
This article is general information, not a substitute for advice from a qualified financial advisor. Consult a qualified financial professional about your own circumstances before acting on anything here.